Bitcoin continued its upward movement from $ 9,200 to $ 9,940 on the last week and achieved a gain of about 8 percent weekly. Continuing bullish at the start of the new week, BTCUSDT gained more than 10 percent in just one day. Also, on July 27, 2020, Bitcoin price saw the highest value of the year at $ 11,420. In our weekly Bitcoin analysis, BTCUSDT reviewed its critical levels in the uptrend.
An Important Break From Bitcoin at the Beginning of the Week
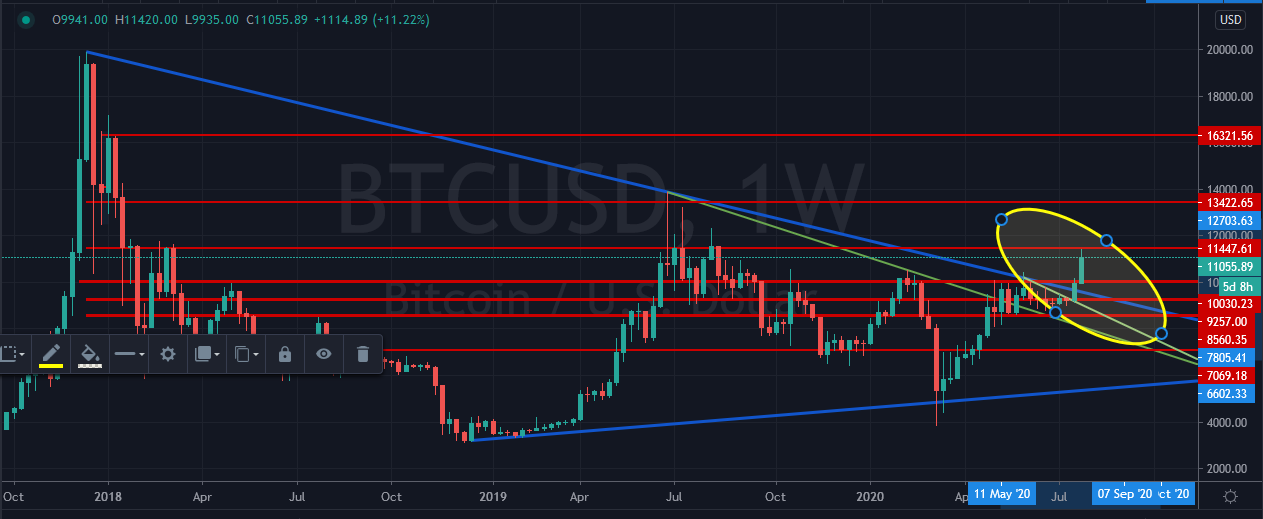
Starting the new week fast, Bitcoin bulls managed to stay above the $ 10,000 price this time. High-volume buyers have helped Bitcoin rise above the main downtrend (blue line) of 2017 peak. After this important break, the BTCUSDT pair can continue its upward attacks as long as it is priced above $ 10,500 this week.
In the rising trend of Bitcoin, the first serious resistance is at $ 11,450. If this resistance price cannot be exceeded, BTC may enter a band movement in the range of $ 11,500 – $ 10,000.
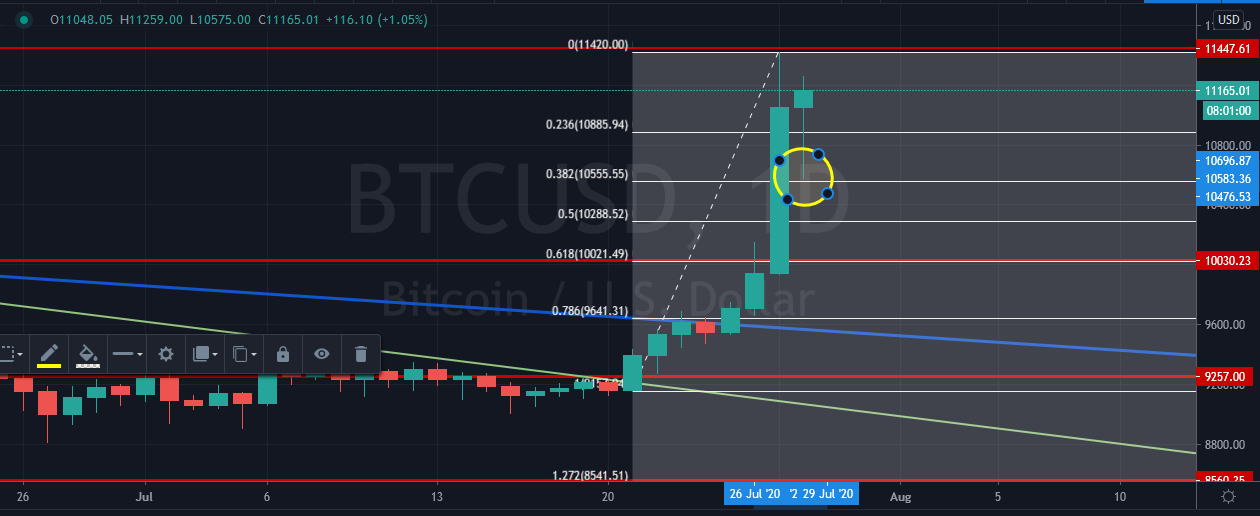
BTCUSDT recent price movements; After the momentum, which started at $ 9,200, peaked at $ 11,420, there were some profit sales today. The short-term correction seen on the second day of the week lasted up to Fib 0,382 (according to the last bottom and peak measurement). If BTC does not slip below this level today, the probability of testing the final peak price again becomes stronger. Above $ 11,500, the next resistance price is seen as $ 13,500.
If the day closes below $ 10,500, we can see that the correction may deepen this time. In this case, the closest support levels are; It looks like $ 10,200 – $ 10,000 and $ 9,640.
Bitcoin Weekly Analysis: When Look at the Important Technical Indicators…
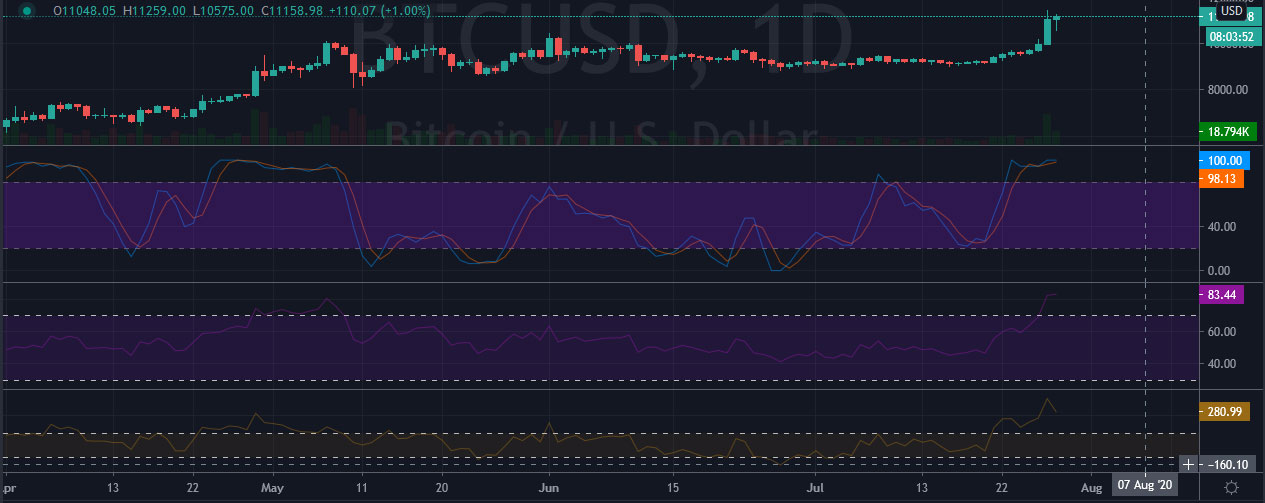
When we look at the latest status of the basic indicators such as Stochastic RSI, RSI and CCI, we see that overbought conditions are now occurring in the daily view of the BTCUSDT parity. At the beginning of last week, these important indicators showed that Bitcoin is an important bullish zone against the dollar.


